KSA Venture Capital: The H1 2026 Review
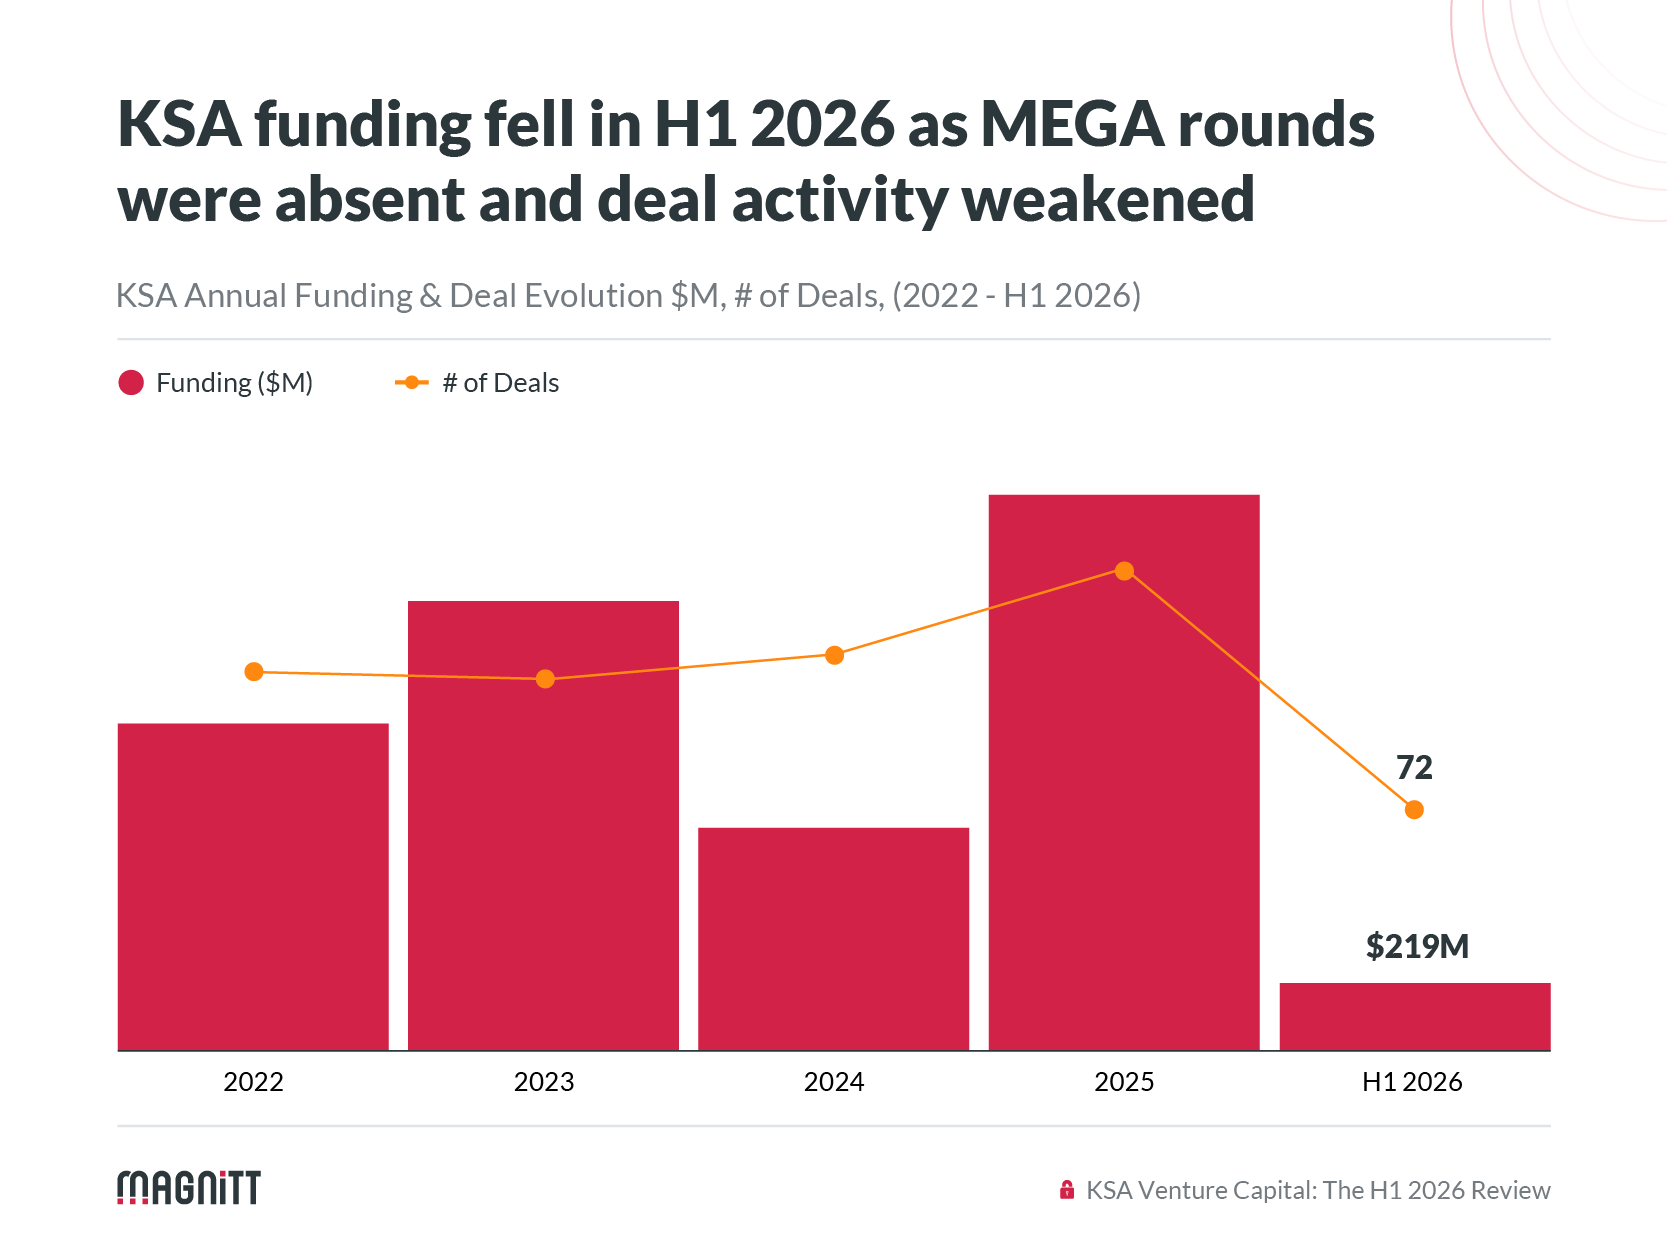
Saudi startups raised $219M across 72 deals in H1 2026. Funding declined 74% year-on-year while deal count decreased 41%, largely reflecting the absence of the large later-stage transactions that contributed significantly to H1 2025 funding rather than an even slowdown across the market.
The headline figures reflected different trends across funding stages. Pre-Seed and Seed activity declined and no Series B or Series C+ rounds were recorded, while Series A remained broadly stable at roughly $105M across seven deals, supported by several mid-sized FinTech transactions.
Funding also became more concentrated across a relatively small group of companies. FinTech accounted for 67% of funding despite a 41% decline, the 10 largest rounds represented about 64% of total capital, and KSA-based investors supplied 74% of funding as international participation declined. This review examines the quarterly and monthly funding path, changes across funding stages and round sizes, Saudi Arabia's position within MENA, shifts in sector and investor activity, and the indicators to watch through H2.
📊 Key Takeaways
-
Funding fell much faster than activity. Saudi startups raised $219M across 72 deals, with funding down 74% year-on-year against a 41% decline in deals, as no late-stage funding rounds were recorded.
-
No MEGA rounds closed. KSA recorded no $100M+ rounds in H1 2026, after MEGA transactions contributed $414M a year earlier, so all H1 2026 funding came from deals below $100M.
-
Series A remained stable while earlier and later stages moderated. Seven Series A rounds worth about $105M nearly matched the prior year, even as Pre-Seed and Seed funding fell 48% and no Series B or Series C+ rounds were recorded.
-
Capital concentrated in FinTech and larger transactions. FinTech absorbed 67% of funding despite a 41% decline, and the 10 largest rounds accounted for about 64% of the H1 total, seven of them being FinTech startups.
-
Domestic investors supplied a larger share of funding. KSA-based investors supplied 74% of funding, up from 54% a year earlier, while the international share declined from 36% to 13%.
🎯 Who Should Read This Report
This report is for investors, fund managers, and founders tracking how MENA venture is absorbing a prolonged-conflict environment, and where capital is still flowing
-
Limited Partners and institutional investors weighing continued allocation to Saudi and MENA vehicles through a sharp funding contraction.
-
General Partners and venture investors benchmarking deal flow, stage activity, and concentration against the wider market.
-
Founders gauging which stages, sectors, and cheque sizes are still attracting capital heading into H2 2026.
-
Corporates, policymakers, and ecosystem builders tracking the resilience of Saudi Arabia's venture pipeline and the conditions for recovery.
Where is this data from?
The report was created using MAGNiTT's proprietary data platform, the leading VC and PE intelligence platform across the Middle East, Africa, Pakistan, Türkiye, and Southeast Asia. With data on 34,800+ startups, 22,500+ funding rounds, and 1,300+ exits, MAGNiTT provides one of the region's most comprehensive technology datasets.
The MGTI combines MAGNiTT's proprietary venture intelligence with publicly available market data, including exchange filings, company disclosures, share prices, free-float market capitalisation, liquidity metrics, and benchmark indices. Updated quarterly, the index provides a transparent and consistent measure of MENA's listed technology sector.
Learn how MAGNiTT can help your business today!