MENA's venture divide: what five years of data show about ecosystem depth
The MENA Ecosystem Benchmarking Index 2021–2025 benchmarks 12 core markets using verified venture data. Three have separated from the rest, and macroeconomic strength alone does not explain why.
In this first edition of the index, MAGNiTT scores each market on 22 indicators and publishes the full methodology so the results can be tested and improved. Its central finding is that what separates leading and emerging ecosystems is less their economic fundamentals than their venture depth: whether they have built capital depth, later-stage pathways, exits, and sustained investor participation.
→ Explore the deal, investor, and funding data behind the index on the MAGNiTT platform, talk to our team.
2025 was the highest-funded year of the period
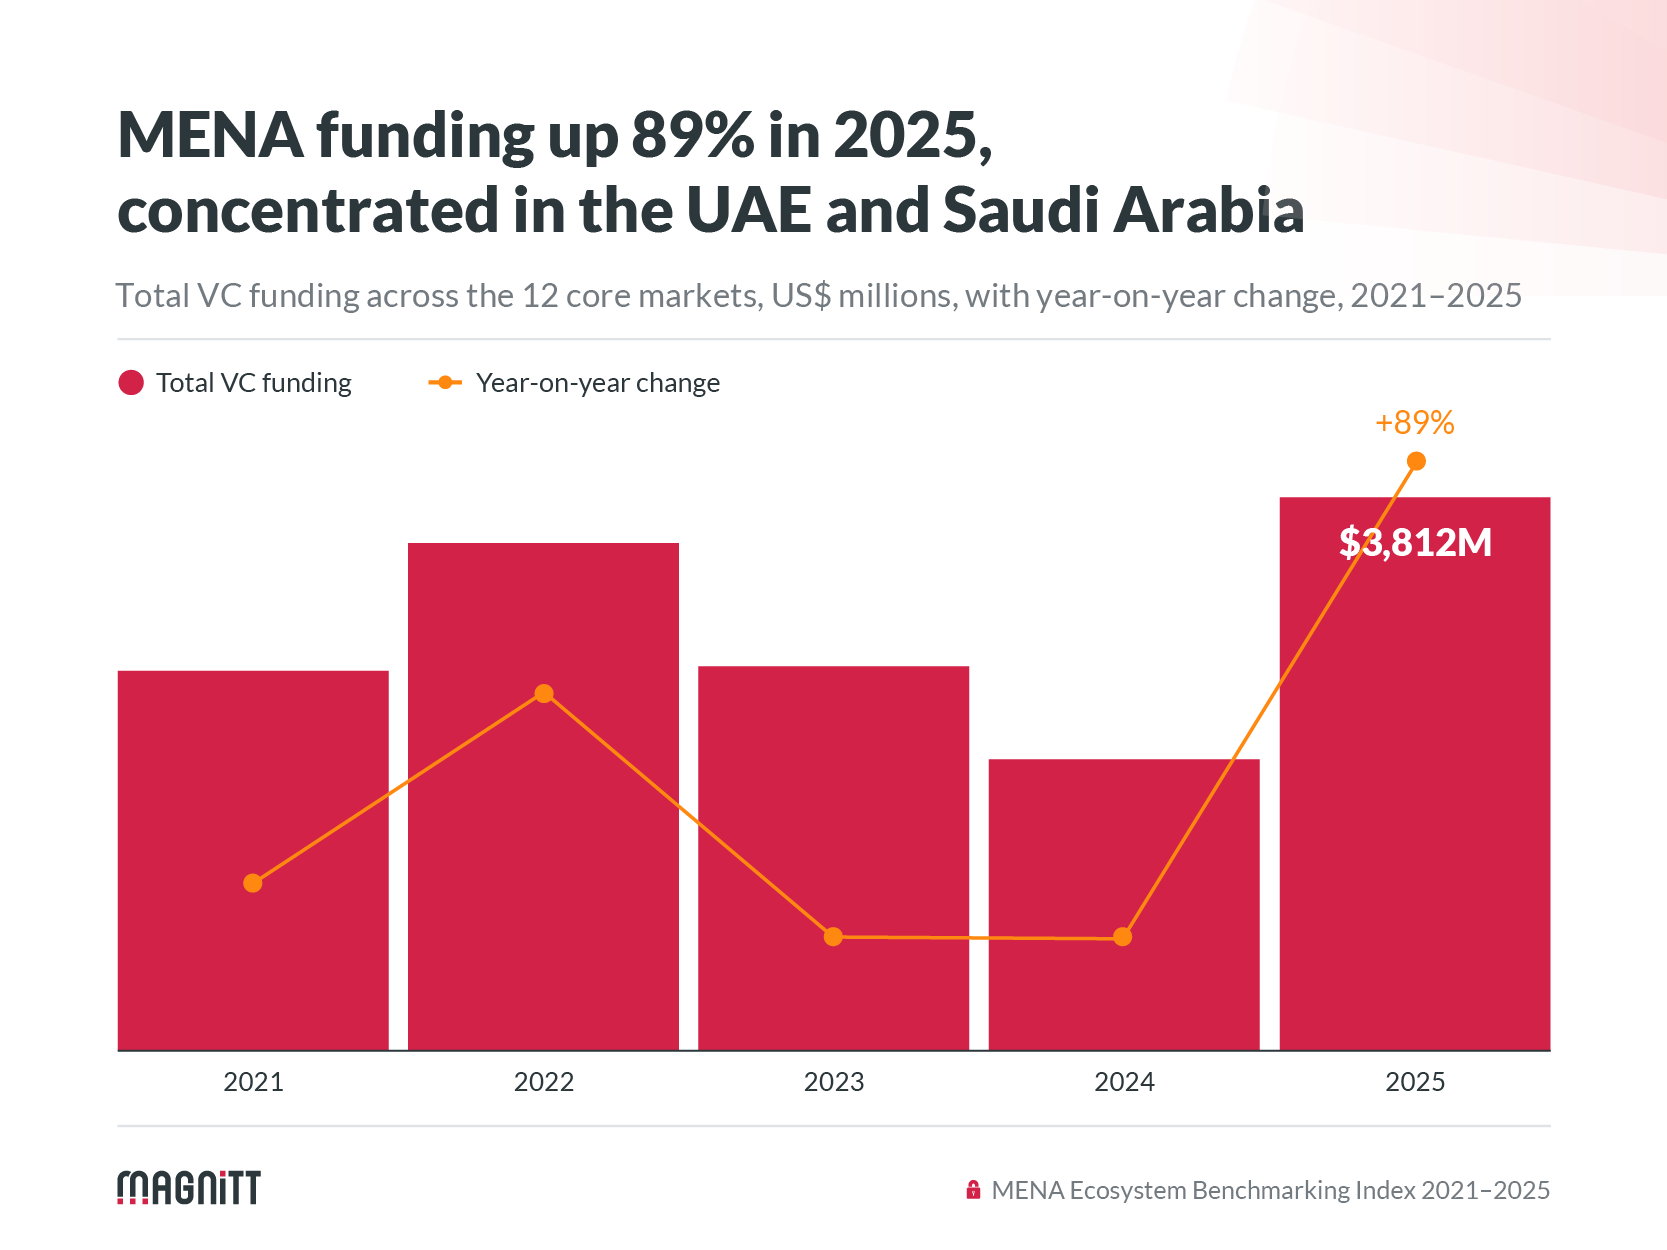
MENA funding rose 89% in 2025 to $3.8B, the highest annual total in the 2021–2025 window, 8.9% above the previous peak in 2022.
Three ecosystems stand apart, and the gap to fourth is wide
Each market receives a composite score out of 100, built from 22 indicators across four pillars. These cover macroeconomic foundations, exits & maturity, ecosystem scale & activity, and investor landscape. A higher score means a market performs more consistently across all of them, not just on funding volume.
On that scale, the UAE scores 82.2 and Saudi Arabia 74.2, reflecting ecosystems where capital depth, growth-stage activity, and investor participation have developed together. Egypt ranks third at 48.2. That is well ahead of the rest of MENA but roughly 26 points behind Saudi Arabia, indicating a market with established activity and thinner depth at later stages.
Below the top three, the index compresses sharply. Tunisia, in fourth place, scores 24.1, less than a third of the UAE's score. The 24.1-point gap between Egypt and Tunisia is larger than the entire range covering the nine markets below third place. Beyond the top tier, most MENA markets are at a similar stage of development, with none yet building the combination of depth that defines the UAE and Saudi Arabia.
Capital is more concentrated than the scores suggest
The UAE, Saudi Arabia, and Egypt captured 91% of the total raised across the 12 core markets between 2021 and 2025. The UAE and Saudi Arabia alone accounted for 76%. The remaining nine markets shared 9% of five-year funding. Access the report now for full data.
Growth-stage capital sits in two markets
Nine ecosystems recorded at least one Series B+ transaction, but Saudi Arabia and the UAE accounted for 87% of capital deployed at that stage. For most markets, the constraint is not reaching Series B+ once. It is building recurring growth-stage activity beyond isolated transactions.
Macroeconomic strength does not guarantee venture depth
Qatar and Kuwait score comparatively well on the macroeconomic pillar but materially lower on venture activity. Economic fundamentals need to translate into deal flow, active investors, and exits before an ecosystem develops depth.
International investors follow existing depth
Cross-border investor activity is strongly associated with five-year funding levels. Markets with greater venture depth also attract more external capital. That creates a reinforcing challenge for emerging ecosystems seeking to close the gap.
What the index means
For governments and ecosystem enablers, it identifies which pillars separate their market from regional peers. For investors and LPs, it maps where growth-stage pathways and exits are established and where they remain thin. For corporates, it shows where ecosystem depth supports partnerships, investment, or market entry. For founders, it indicates where follow-on and growth-stage capital is concentrated.
The full report explores pillar-level scores and country snapshots for each market, alongside the macro foundations and ecosystem scale behind them. It also covers stage mix and exit speed by market, cross-border investor participation by ecosystem, and the methodology and pillar weighting used to build the index.
→ Download the MENA Ecosystem Benchmarking Index 2021–2025 here.